Buying an endpoint security tool is easy. Knowing whether it actually protects you is much harder. Many organizations deploy antivirus, EDR, or a full endpoint protection platform, watch the dashboard turn green, and assume the job is done. Then a ransomware attack slips through an unmanaged laptop or an unpatched server, and the gap becomes painfully obvious.
Every laptop, desktop, server, mobile device, and virtual machine connected to your network is a potential entry point. With remote work, cloud workloads, and BYOD now standard, the number of endpoints has exploded, and attackers know it. Most successful breaches still begin at the endpoint, whether through a phishing attachment, a malicious download, or stolen credentials used on a poorly protected device.
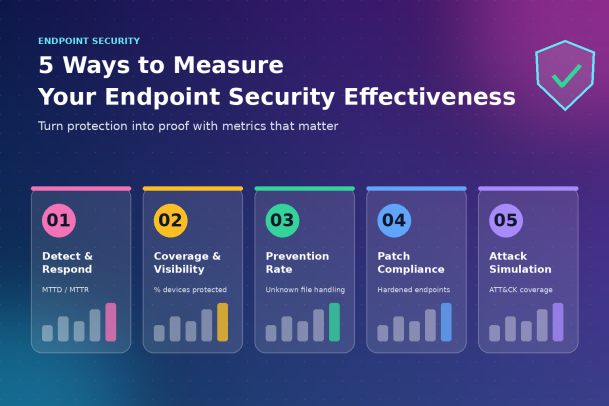
That is why measuring endpoint security effectiveness matters as much as deploying it. In this guide, we walk through five practical ways to measure how well your endpoint security is really working, the metrics to track for each, and how to turn those numbers into decisions that reduce risk.
Why Measuring Endpoint Security Effectiveness Matters
Endpoint security effectiveness is not about how many alerts your tools generate or how many products you own. It is about outcomes: how many threats you stop, how quickly you contain the ones that get through, and how much of your environment is actually protected.
Without measurement, security teams face three common problems. First, they cannot prove value to leadership, which makes budget conversations difficult. Second, they cannot spot blind spots until an attacker finds them first. Third, they cannot tell whether a new tool, policy, or process change made things better or worse.
Good metrics solve all three. They give you a baseline, show trends over time, and turn security from a cost center into a measurable business function. Here are five ways to do it.
1. Track Mean Time to Detect (MTTD) and Mean Time to Respond (MTTR)
Speed is one of the clearest indicators of endpoint security effectiveness. The longer a threat sits undetected on a device, the more time an attacker has to steal credentials, move laterally, and deploy ransomware.
Mean Time to Detect (MTTD) measures the average time between a threat reaching an endpoint and your team or tools identifying it. Mean Time to Respond (MTTR) measures the time from detection to containment, such as isolating the device, killing the process, or removing the malware.
To measure these well:
- Pull timestamps from your EDR, SIEM, and ticketing system for every confirmed incident.
- Calculate averages monthly, but also track the median and worst cases, since a single slow response can cause most of the damage.
- Separate automated responses from manual ones to see where human bottlenecks exist.
A falling MTTD and MTTR over time shows your endpoint security stack and processes are maturing. If the numbers stay flat or climb, look at alert fatigue, staffing, or missing automation. Strong endpoint protection platforms shrink both metrics by containing suspicious activity automatically, before an analyst ever opens a ticket.
2. Measure Endpoint Coverage and Visibility
You cannot protect what you cannot see. One of the most overlooked endpoint security metrics is simple coverage: what percentage of your devices actually have an active, up-to-date security agent?
Shadow IT, contractor laptops, forgotten test servers, and new cloud instances often fall outside the security team’s view. Each one is an open door. To measure coverage:
- Compare your asset inventory (from CMDB, Active Directory, MDM, and cloud consoles) against devices reporting to your endpoint security platform.
- Track the percentage of endpoints with agents installed, running, and checking in within the last 24 hours.
- Monitor agent health, including outdated versions, disabled protection, and devices that have gone silent.
A healthy target is 98% coverage or higher, with a clear process to investigate every unprotected device. Visibility also includes the depth of telemetry: can you see process activity, network connections, and file changes on each endpoint, or only basic antivirus alerts? Rich visibility is what makes threat hunting and fast investigation possible.
3. Evaluate Prevention Rate and Unknown File Handling
Detection after the fact is useful, but prevention is better. Your prevention rate measures the share of threats blocked before they execute or cause harm, compared with those that required investigation or cleanup.
Traditional antivirus relies on signatures, which only catch known threats. Modern attacks increasingly use zero-day exploits, fileless malware, and polymorphic code that no signature has seen before. So a critical question is: what does your endpoint security do with unknown files?
Key metrics to track here include:
- Prevention rate: threats blocked before execution divided by total threats observed.
- Unknown file verdict time: how long it takes to classify a never-before-seen file as safe or malicious.
- Infections from unknown files: incidents traced back to files that were allowed to run while still unclassified.
- False positive rate: legitimate files or applications wrongly blocked, which affects productivity and user trust.
The best results come from a default-deny or Zero Trust approach, where unknown files run in an isolated environment until they are proven safe. This lets users keep working while ensuring that unverified code can never damage the real system.
4. Monitor Patch Management and Configuration Compliance
Many endpoint breaches do not need sophisticated malware at all. They exploit known vulnerabilities that were never patched, or devices configured with weak settings such as local admin rights, disabled firewalls, or open remote access ports.
Patch and configuration compliance shows how hardened your endpoints are against these easy wins for attackers. Track:
- Patch compliance rate: the percentage of endpoints fully patched within your policy window, for example critical patches within 7 days.
- Mean time to patch: the average time between a patch release and its deployment across your fleet.
- Critical vulnerability exposure: the number of endpoints carrying known, actively exploited vulnerabilities.
- Configuration drift: devices that no longer match your security baseline, such as CIS benchmarks.
These metrics bridge IT operations and security. Sharing them across both teams creates accountability and helps prioritize the fixes that reduce the most risk. A high patch compliance rate combined with strong prevention means attackers have far fewer ways in.
5. Test Your Defenses with Attack Simulations and Red Team Exercises
Metrics from real incidents tell you what has happened. Testing tells you what could happen. The most reliable way to measure endpoint security effectiveness is to attack yourself, safely and on purpose.
Breach and attack simulation (BAS) tools, penetration tests, and red team exercises replay real attacker techniques against your endpoints. Mapping these tests to the MITRE ATT&CK framework shows exactly which tactics your defenses catch and which ones slip past. Measure:
- Detection coverage: the percentage of simulated techniques your tools detected or blocked.
- Alert quality: whether the alerts generated were accurate, clear, and actionable.
- Response performance: how quickly and correctly your team handled the simulated incident.
- Phishing resilience: click and report rates from user awareness simulations, since users are often the first line of endpoint defense.
Run these tests regularly, at least quarterly, and after major changes to your environment. Each test should produce a short list of gaps to close, and the next test should confirm they are fixed.
Building Your Endpoint Security Scorecard
Each of these five measures tells part of the story. Together, they form a scorecard you can review monthly and share with leadership.
| Measure | Key metric | Suggested target |
|---|---|---|
| Detection and response | MTTD / MTTR | Minutes to hours, trending down |
| Coverage and visibility | % endpoints protected | 98%+ |
| Prevention | Prevention rate, unknown file infections | Near-zero infections from unknown files |
| Patch and configuration | Critical patch compliance | 95%+ within 7 days |
| Testing | ATT&CK techniques detected | Rising each quarter |
Adjust targets to your industry, risk appetite, and compliance requirements such as HIPAA, PCI DSS, or GDPR. The goal is steady improvement, not perfection on day one. Automate data collection wherever possible so the scorecard stays current without draining analyst time.
Conclusion: Turn Endpoint Security Metrics into Real Protection
Endpoint security is only as strong as your ability to prove it works. By tracking detection and response times, endpoint coverage, prevention rates, patch compliance, and results from regular attack simulations, you gain a clear, honest picture of your defenses. More importantly, you know exactly where to invest next.
The organizations that stay ahead of attackers are not the ones with the most tools. They are the ones that measure, learn, and improve continuously, and that choose endpoint protection designed to stop unknown threats before they can do damage.
Ready to see how your endpoint security measures up? Xcitium’s Zero Trust endpoint protection isolates unknown files in real time, so threats never get a chance to execute on your real system, while your users keep working without interruption. Get full visibility, faster response, and measurable protection across every endpoint.
Request a Demo with Xcitium and discover how to make your endpoint security effectiveness something you can prove, not just hope for.
Please give us a star rating based on your experience.


 (19 votes, average: 2.42 out of 5, rated)