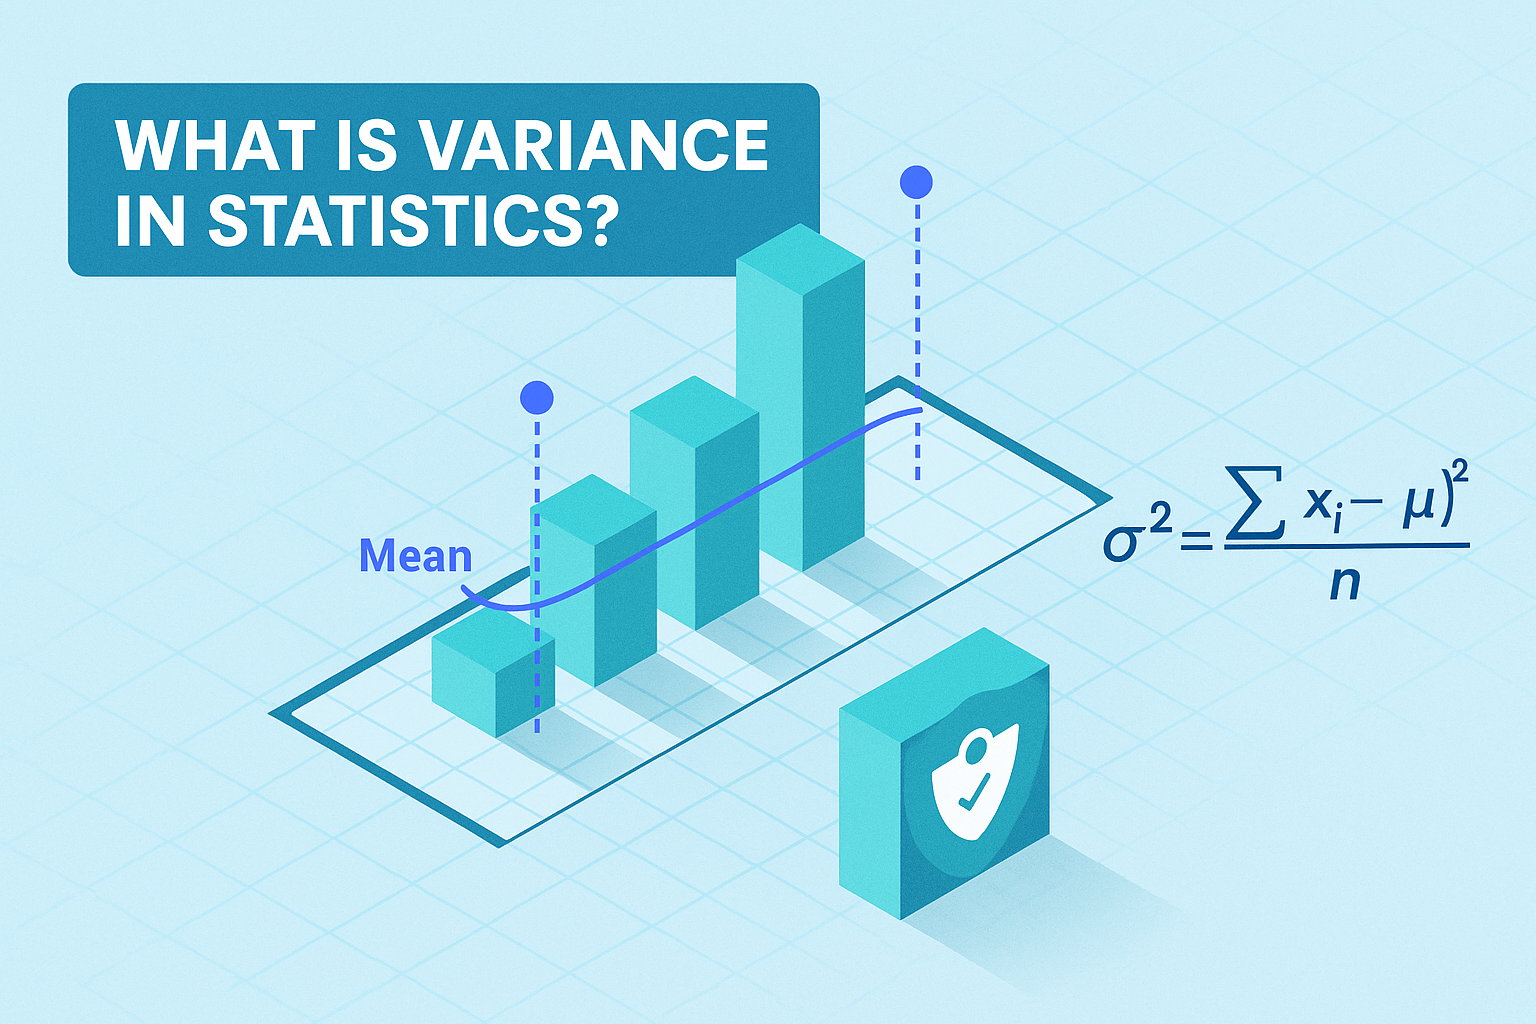
What is Variance in Statistics? A Complete Guide for Beginners and Professionals
Updated on August 26, 2025, by Xcitium

Ever wondered how statisticians and analysts measure how spread out data is? That’s where variance in statistics comes in. Variance tells us how far values deviate from the average (mean). Whether you’re analyzing cybersecurity logs, financial data, or customer behavior, understanding variance is crucial. It helps IT managers, business leaders, and data professionals make informed decisions by identifying trends, risks, and anomalies in data.
In this guide, we’ll explain what is variance in Statistics in simple terms, walk through examples, and show why it matters in both statistics and real-world applications.
What is Variance in Statistics?
In simple words, variance measures the spread of a set of numbers. It calculates the average squared difference from the mean (average).
- High variance means data points are spread out (more unpredictable).
- Low variance means data points are close to the mean (more consistent).
👉 Formula for variance:
σ2=∑(xi−μ)2N\sigma^2 = \frac{\sum (x_i – \mu)^2}{N}σ2=N∑(xi−μ)2
Where:
- xix_ixi = each data point
- μ\muμ = mean of the dataset
- NNN = total number of data points
Why Variance is Important
Variance is the backbone of many statistical methods. Here’s why it matters:
- Data analysis → Understand variability in datasets.
- Risk assessment → Used in finance and cybersecurity to measure volatility or irregular patterns.
- Quality control → Helps businesses ensure consistent processes.
- Machine learning → Variance is key to evaluating models (bias-variance tradeoff).
Types of Variance
1. Population Variance
Measures variance across an entire population. Formula divides by NNN.
2. Sample Variance
Measures variance in a subset of data (sample). Formula divides by N−1N-1N−1.
👉 Example:
- Population variance is used when analyzing data for all users.
- Sample variance is used when analyzing data from only 1,000 users out of 10,000.
Step-by-Step Example of Variance
Imagine five cybersecurity incidents reported in a week with severities scored as: 2, 4, 4, 6, 8.
- Find the mean:
(2 + 4 + 4 + 6 + 8) ÷ 5 = 4.8 - Subtract mean & square values:
- (2 − 4.8)² = 7.84
- (4 − 4.8)² = 0.64
- (4 − 4.8)² = 0.64
- (6 − 4.8)² = 1.44
- (8 − 4.8)² = 10.24
- Add results:
7.84 + 0.64 + 0.64 + 1.44 + 10.24 = 20.8 - Divide by number of items (N=5):
20.8 ÷ 5 = 4.16
👉 Variance = 4.16 (moderate spread in the data).
Variance vs. Standard Deviation
- Variance → Average of squared deviations.
- Standard Deviation (SD) → Square root of variance (easier to interpret since it’s in original units).
Example: If variance = 4.16, then SD = √4.16 ≈ 2.04.
Applications of Variance in Real Life
- Cybersecurity: Detect anomalies in traffic logs or unusual login attempts.
- Finance: Measure risk/volatility of investments.
- Healthcare: Analyze patient data variability.
- Business intelligence: Track customer purchase behavior.
- Manufacturing: Ensure quality consistency in product output.
Common Mistakes in Understanding Variance
- Thinking variance = standard deviation (they are related but not the same).
- Forgetting to square deviations (which avoids negative values).
- Using population formula instead of sample formula in small datasets.
Frequently Asked Questions (FAQ)
1. What does variance in statistics measure?
It measures how far data points are spread out from the mean.
2. Is variance always positive?
Yes, because deviations are squared, variance cannot be negative.
3. What is the difference between variance and standard deviation?
Variance shows the squared spread, while standard deviation is the square root of variance (easier to interpret).
4. Why is variance important in machine learning?
It helps balance model accuracy with flexibility in the bias-variance tradeoff.
5. What is a real-world example of variance?
Stock market volatility: A high-variance stock fluctuates more than a low-variance stock.
Final Thoughts
Understanding what is variance in statistics gives you the power to interpret data correctly and make informed decisions. Whether you’re managing cybersecurity risks, analyzing financial trends, or improving business processes, variance provides the foundation for deeper insights.
Ready to Strengthen Your Cybersecurity and Data Insights?
Take control of your data with Xcitium’s advanced security and analytics solutions.


