If your computer has ever slowed down, shut off unexpectedly, or made you nervous with loud fan noise, temperature is usually the first thing worth investigating. Heat is the silent killer of PC hardware — it throttles performance, shortens component lifespan, and in extreme cases can cause permanent damage. Whether you’re a first-time PC builder or a systems administrator managing a fleet of machines, knowing how to check PC temps is a fundamental skill.
This guide walks through why temperature monitoring matters, what “normal” temperatures look like, the best tools for checking CPU, GPU, and motherboard temps, and how to interpret the numbers you see — for both casual users and IT professionals.
Why Monitoring PC Temperature Matters
Every component inside your computer generates heat as it works. The CPU and GPU, in particular, can produce significant heat under load, especially during gaming, video rendering, or heavy computational tasks. Left unchecked, excess heat causes:
- Thermal throttling — your CPU or GPU automatically reduces its clock speed to cool down, tanking performance right when you need it most.
- System instability — random crashes, blue screens, or unexpected shutdowns are common symptoms of overheating.
- Reduced hardware lifespan — consistently running hot accelerates wear on capacitors, solder joints, and thermal paste.
- Fire and safety risk — while rare, extreme overheating in poorly ventilated systems can pose genuine safety concerns.
For everyday users, checking temps helps you catch problems before they become expensive repairs. For IT professionals and businesses, temperature monitoring is part of a broader endpoint health and security strategy — overheating servers or endpoints can indicate hardware failure, dust buildup, malware-driven resource abuse (like cryptomining malware maxing out your CPU), or misconfigured workloads.
What Are Normal PC Temperatures?
Before diagnosing a problem, it helps to know your baseline. Here are general guidelines (actual safe ranges vary by manufacturer and model):
| Component | Idle Temp | Normal Load Temp | Warning Zone |
|---|---|---|---|
| CPU | 30–45°C | 50–75°C | 85°C+ |
| GPU | 30–50°C | 60–80°C | 85–90°C+ |
| Motherboard/Chipset | 25–40°C | 40–55°C | 60°C+ |
| HDD/SSD | 25–35°C | 35–50°C | 55°C+ |
If your components consistently run above these ranges under normal use, it’s a sign you need better cooling, dust cleaning, or fresh thermal paste.
How to Check CPU Temperature
On Windows
- Use the BIOS/UEFI. Restart your PC and enter BIOS setup (usually by pressing Delete, F2, or Esc during boot). Most modern BIOS interfaces display real-time CPU temperature under a “Hardware Monitor” or “PC Health” tab. This gives you an idle reading in a controlled environment, though it won’t show temps under real workloads.
- Use dedicated monitoring software. Free tools like HWMonitor, Core Temp, or Open Hardware Monitor read temperature sensors directly and display live readings while you use your PC normally. These are more useful than BIOS because they capture real-world load temperatures during gaming, rendering, or multitasking.
- Use Task Manager (limited). Windows 11’s Task Manager now shows basic GPU temperature under the Performance tab for some graphics cards, though CPU temperature isn’t natively included.
On macOS
macOS doesn’t expose temperature data as readily as Windows. Third-party tools such as iStat Menus or Macs Fan Control can display CPU and GPU temperatures in the menu bar, along with fan speeds.
On Linux
Most distributions can use the lm-sensors package. After installing it (sudo apt install lm-sensors on Debian/Ubuntu-based systems), run sensors in the terminal to output live temperature readings for your CPU cores and other detected sensors.
How to Check GPU Temperature
Your graphics card often runs hotter than your CPU, especially during gaming or GPU-accelerated workloads like 3D rendering or machine learning training. To check GPU temperature:
- NVIDIA users can open the NVIDIA Control Panel or use the
nvidia-smicommand in a terminal for a detailed readout including temperature, memory usage, and power draw. - AMD users can check temperatures through AMD Software: Adrenalin Edition, which includes a performance overlay with live metrics.
- Cross-platform tools like MSI Afterburner (works with both NVIDIA and AMD cards) provide an in-game overlay showing GPU temp, usage, clock speed, and fan RPM in real time — extremely useful for diagnosing thermal throttling during gameplay.
All-in-One Monitoring Tools
Rather than juggling separate tools for CPU, GPU, motherboard, and storage temps, many users prefer comprehensive system monitoring software that displays everything in one dashboard. Popular options include:
- HWiNFO — extremely detailed sensor data covering nearly every component, popular among enthusiasts and overclockers.
- AIDA64 — a paid but professional-grade tool offering benchmarking alongside temperature monitoring, commonly used in enterprise IT environments.
- Speccy — a simpler, beginner-friendly option that summarizes system specs and temperatures in an easy-to-read layout.
For IT teams managing multiple endpoints, standalone desktop tools don’t scale well. Enterprise environments typically need centralized monitoring that can flag overheating devices, failing hardware, or resource anomalies across an entire network from a single console — which ties directly into broader endpoint management and security platforms.
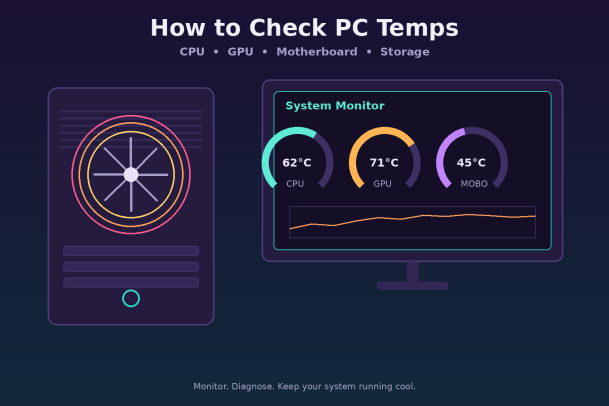
Interpreting the Numbers: What to Do If Your PC Runs Hot
Seeing high temperature readings is only useful if you know how to respond. Here’s a troubleshooting checklist:
- Clean out dust. Dust buildup on fans, heatsinks, and vents is the most common — and easiest to fix — cause of rising temperatures over time. A can of compressed air every few months goes a long way.
- Check fan function. Make sure all case fans and the CPU/GPU coolers are spinning correctly. A failed fan is often the root cause of a sudden temperature spike.
- Reapply thermal paste. Thermal paste dries out over 2–5 years, reducing heat transfer from the CPU to its cooler. Reapplying fresh paste can meaningfully lower idle and load temperatures.
- Improve airflow. Ensure your case has adequate intake and exhaust fans, and that cables aren’t blocking airflow. Consider case placement — tight enclosures or direct sunlight can raise ambient temperatures.
- Check for background processes. Unexpectedly high CPU usage at idle can indicate malware, especially cryptojacking scripts that hijack system resources to mine cryptocurrency without your knowledge. If temperatures spike alongside unexplained CPU usage, a security scan is warranted.
- Consider undervolting or repasting for laptops. Thin laptop chassis have limited cooling headroom; undervolting the CPU (reducing voltage while maintaining clock speed) can significantly cut heat output without major performance loss.
Why This Matters for Businesses and IT Teams
For individual users, an overheating PC is an inconvenience. For businesses, it’s a risk multiplier. A single overheating endpoint can indicate:
- Aging hardware nearing failure, risking downtime and data loss.
- Malware consuming system resources undetected, a common sign of compromise.
- Misconfigured or overloaded systems running workloads beyond their design capacity.
Modern endpoint security platforms go beyond just checking temperatures — they continuously monitor device health, detect anomalous resource usage patterns (like sudden CPU spikes tied to malicious processes), and give IT teams centralized visibility across every device on the network. Combining hardware health monitoring with proactive threat detection helps organizations catch problems — whether mechanical or malicious — before they escalate into costly incidents.
Final Thoughts
Checking your PC’s temperature doesn’t have to be complicated. For casual users, built-in BIOS readouts and free tools like HWMonitor or Core Temp are usually enough to catch obvious problems. For enthusiasts and professionals, more detailed tools like HWiNFO or AIDA64 offer granular insight into every sensor in the system. And for IT teams managing many endpoints, temperature and resource monitoring should be part of a broader, centralized security and device management strategy — one that can distinguish between a dusty fan and a malicious process quietly overheating your hardware.
Staying on top of your system’s thermal health isn’t just about performance — it’s about protecting your investment and, in a business context, protecting your entire network from threats that manifest as unusual hardware behavior.
Ready to strengthen your endpoint visibility and security?
Overheating hardware is sometimes just dust — but sometimes it’s a sign of something worse. Xcitium’s endpoint protection platform gives you the visibility and control to catch both.
Please give us a star rating based on your experience.


 (20 votes, average: 2.60 out of 5, rated)