Once stored, logs contain sensitive data that must be safeguarded from tampering during transit and unapproved access, examination, and deletion. Logging activities should reflect any potential information security risks.
Many systems provide network device, operating system, and server logs; however, custom application logging often gets overlooked despite providing more insight than infrastructure logs alone.
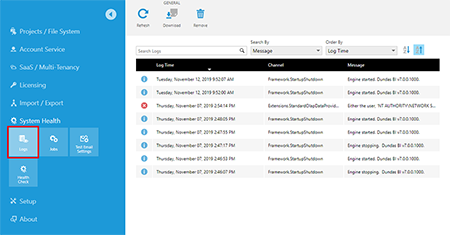
Log files are a source of information.
Application logs provide IT teams with valuable insights that enable them to investigate outages, fix bugs and assess security incidents, track user behavior, plan system capacity, and audit regulatory compliance. Unfortunately, interpreting application logs without the right tools can be challenging, but there are ways of making the process simpler and more effective.
Start by understanding the types of events logged. This way, you can determine what needs to be analyzed and prioritized. For instance, availability issues such as startup/shutdown times/backup successes/failures are some of the more frequent types. Furthermore, monitoring resource and network usage is critical to detect performance degradation before they lead to outages.
Error logs can provide another valuable source of insight. Identifying errors that cause the application to behave unexpectedly and providing solutions quickly - such as network latencies or server memory shortage - may help shorten the mean time to recovery (MTTR). Error logs also offer a historical perspective into factors that led to incidents like bugs or incompatible library versions, providing historical insight that provides additional context about why some incidents happened in the first place.
Centralizing application logs and organizing them into a uniform format will save space while making information retrieval faster and simpler. For instance, if multiple applications share one database, a central log management system can combine and store their logs in one central place.
Once your application logs are centralized, they can quickly be sorted and analyzed to help enhance products and services. You can analyze customer behavior to meet customers' needs better, while visualizing log data can reveal trends that can help identify issues faster and reduce operational costs.
They are a source of trouble.
Application log files provide invaluable troubleshooting data for understanding software performance and user interactions. They contain detailed information about your application's behavior - such as error messages and HTTP requests - which could prove helpful when trying to troubleshoot its issues. Logs provide valuable insight into how your system is configured and can help determine the source of an issue. A robust log management system should be in place. An ideal way to use an aggregate logs management platform that collects them all together in one location and automatically detects and alerts you of suspicious events.
No matter what OS your organization utilizes - Windows or Linux - each operating system generates its syslog file, which logs events such as startup messages and unexpected shutdowns. When using cloud services, it may be worthwhile inquiring with them regarding which types of logs may be produced by these providers.
Before creating an application log, you must define which events to record. This decision depends on how your software is being used, who will view the logs (developers, QA testers, support, advanced users, etc.),and any issues being faced - failing which, infrastructure event logging alone may limit what insights can be gleaned into how it is performing.
Mistakenly restricting the scope of your logs to specific assets is another mistake to be avoided. When default configurations create and write to multiple logs simultaneously, this can create too much redundant information and slow user response times. To address this problem more efficiently, log management services automate creating and rotating of logs automatically.
As part of an effective monitoring and troubleshooting plan for your application, having detailed logs that provide sufficient context is key to finding solutions quickly. Understanding timestamp, log level, thread name, and fully qualified class names helps identify root causes and remedy issues quickly; additionally, it is helpful to have standard failure message formats set up so they're easy to spot on an automated testing server.
They are a source of data.
Application logs can provide invaluable information that can assist in identifying problems in software. They offer detailed timestamped information that allows pinpointing exactly when and where a software issue arises, improving business operations by pinpointing the root causes of issues and eliminating bottlenecks. Moreover, application logs may also help detect any attempts by third parties to run processes or access restricted information without authorization.
Log management tools simplify the collection and organization of application logs by consolidating them in one location before sending alerts directly to team members. In addition, many tools sync up with messaging systems like Slack or HipChat for instantaneous notifications whenever suspicious activity occurs. To ensure security is paramount when selecting your vendor, ensure they adhere to industry security standards by encrypting sensitive data logs before transmitting them externally.
Focusing your log management strategy around diagnostics and auditing are two significant areas of application monitoring - essential elements in any comprehensive log management strategy. While diagnostics allow organizations to address problems before they impact business operations quickly, proactive approaches could use data from application logs as a preventative measure against issues before they arise.
They are a source of revenue.
Application logs can provide invaluable data that can help you detect software bugs quickly and repair them before they affect customers. They are also essential for meeting HIPAA compliance regulations while offering insight into your application's performance, user experience, and peak seasonal traffic patterns.
Log information stored within an application log can often be sensitive and vulnerable to attack by malicious actors. Therefore, you must protect the security of your application by designing and implementing a logging framework with secure transport and storage to prevent logs from being altered. At the same time, they travel or are stored centrally. Furthermore, your logging solution should notify you automatically whenever an issue arises by creating service desk tickets or taking remediation steps from playbooks as appropriate.
Selecting an effective logging solution can save both time and resources. Most solutions provide a web interface where all your logs can be viewed simultaneously, making troubleshooting issues quick and reducing downtime more efficient. Furthermore, many solutions contain built-in security measures to protect logs, with some even offering detection of potential security threats so you can be alerted of any threats immediately.
Log management tools make locating and analyzing application logs easier, so you can identify potential problems before they impact customers. They also offer historical archives for auditing purposes - a convenient feature in regulated industries like healthcare, where logs must be reviewed regularly.
Application logs provide invaluable business intelligence but can be daunting to manage. To extract maximum value from application logs, a log analysis tool should filter, aggregate, and normalize them - also create reports from these logs and apply customized filters that limit search results.
Application Logs – Definition, Types, and Best Practices for IT Professionals
Every modern application — from web-based SaaS platforms to mission-critical enterprise software — generates logs. These logs are not just technical by-products; they are a vital source of operational, security, and performance insight.
Application logs record the events, transactions, and messages generated by an application during its execution. For IT professionals, these logs are the foundation for troubleshooting issues, monitoring performance, detecting security incidents, and ensuring compliance.
In this guide, we’ll cover what application logs are, the types of logs you should know, key components of a log file, and the best practices for logging — with practical examples aimed at IT, DevOps, and security teams.
What Is an Application Log?
An application log is a file or data stream where an application writes structured or unstructured records about events that occur during its operation.
Purpose of Application Logs:
- Monitoring health: Track normal operation and detect anomalies.
- Debugging issues: Provide forensic data when problems occur.
- Security auditing: Capture authentication, authorization, and transaction records.
- Compliance reporting: Maintain audit trails for regulatory requirements.
Example: In a payment processing app, a log entry might record a successful transaction, an authentication failure, or a timeout connecting to a database.
Application Logging vs. Debugging
Although both serve to diagnose and resolve issues, logging and debugging are distinct processes:
- Debugging is a hands-on, development-phase process, stepping through code to identify and fix a bug.
- Logging is continuous and often automated, capturing events in production for post-incident analysis.
Key difference: Debugging fixes problems before deployment; logging helps understand and resolve issues in live environments.
Key Components of an Application Log
A well-structured log entry typically includes:
| Field | Description | Example |
|---|---|---|
| Timestamp | When the event occurred (UTC recommended) | 2025-08-06T14:15:22Z |
| Log Level | Severity (DEBUG, INFO, WARN, ERROR, FATAL) | ERROR |
| User/Process | Who triggered the event | user: alice |
| Source/Dest | IP/module making and receiving the request | 192.0.2.10 -> db-server |
| Event ID | Unique identifier for correlation | req-98ad2c |
| Message | Human-readable description of the event | Payment timeout |
| Error Details | Exception type/stack trace (if applicable) | TimeoutException at line 120 |
Structured logging (e.g., JSON format) makes these fields machine-readable and searchable in log management tools.
Types of Application Logs
Different logs serve different operational and security purposes:
Access, Authentication & Authorization Logs
- Record login attempts, successful/failed authentications, and resource access.
- Help in security audits and incident investigations.
- Example: INFO User 'bob' failed login from 203.0.113.25
Change Logs
- Track changes to application configuration, user roles, or system settings.
- Support compliance and troubleshooting.
- Example: INFO Role 'Admin' assigned to user 'jane'
Error Logs
- Capture runtime errors, exceptions, and failures.
- Critical for preventing downtime and improving reliability.
- Example: ERROR Database connection timeout on order #34567
Availability Logs
- Record service start/stop events, downtime, and failover actions.
- Help track SLA compliance and uptime metrics.
- Example: WARN Service 'payment-gateway' restarted after failure
Benefits of Centralized Log Management
Rather than keeping logs scattered across servers, centralizing them in a log management system offers:
- Faster Troubleshooting: Search all application logs in one interface.
- Correlation Across Systems: Identify related events using shared IDs or fields.
- Historical Retention: Store and analyze logs over months/years for compliance.
- Visualization: Build dashboards and charts for real-time monitoring.
- Alerting: Trigger alerts for anomalies (e.g., spike in 500 errors).
Popular tools: Elastic Stack, Splunk, Datadog, Graylog, Coralogix.
Application Logging Best Practices
To maximize the value of your logs:
- Aggregate & Centralize Use a log management platform to collect logs from all applications and environments.
- Use Human-Readable Messages Avoid cryptic codes; make entries understandable at a glance.
- Adopt Structured Logging JSON or key-value formats enable parsing and analytics.
- Avoid Sensitive Data Never log passwords, credit card numbers, or personal identifiers in plain text.
- Implement Log Rotation Prevent storage overload by archiving or deleting old logs.
- Set Retention Policies Balance compliance requirements with storage costs.
- Redundancy & Backups Maintain copies of critical logs for disaster recovery.
Example Application Log Entries
Access Log Example:
 pgsql
CopyEdit
2025-08-06T14:10:15Z INFO AuthService user=alice action=login status=success ip=198.51.100.45
Error Log Example:
 vbnet
CopyEdit
2025-08-06T14:15:22Z ERROR PaymentService order_id=34567 error=Timeout connecting to DB
Change Log Example:
 pgsql
CopyEdit
2025-08-06T14:20:10Z INFO UserService user=jane change=role_update new_role=Admin
Using Application Logs for Security
- Detect Intrusions: Monitor for repeated failed logins or access from unusual IPs.
- Identify Indicators of Compromise (IOCs): Look for known malicious IPs, domains, or hashes.
- Forensic Analysis: Trace attacker movements post-breach using correlated log entries.
Advanced Logging Topics for IT Teams
- Correlation IDs: Add unique IDs to link related events across services.
- OpenTelemetry Integration: Standardize log collection and correlate with metrics/traces.
- Real-Time Alerts: Create triggers for threshold breaches (e.g., >50 failed logins in 5 minutes).
- Retention Tiers: Keep high-value logs longer; archive less critical data.
Conclusion
For IT professionals, application logs are more than just a technical necessity — they are strategic assets. By following best practices, categorizing logs effectively, and leveraging centralized management tools, you can transform raw log data into actionable intelligence for operational efficiency, security resilience, and compliance readiness.