What are Internet Information Services Logs?
Internet Information Services logs are records of all requests made to a web server running Microsoft IIS. These logs capture critical data such as IP addresses, requested URLs, HTTP status codes, user agents, timestamps, and response times. They serve as an essential resource for administrators and developers to monitor, analyze, and troubleshoot web server activity. IIS logs help track visitor behavior, detect potential security threats, and optimize server performance.
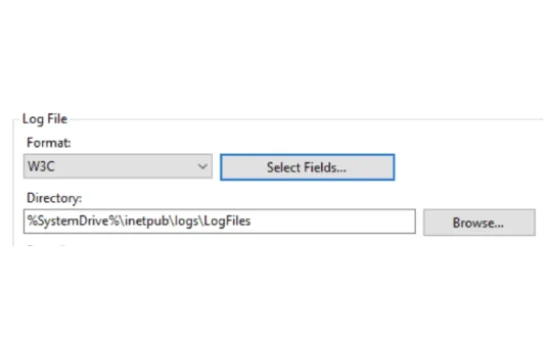
When a user or system interacts with a website or web application hosted on IIS, the server automatically generates log entries for each request. These logs follow a structured format, typically stored in plain text files, making them easy to process and analyze. The most commonly used log format is the W3C Extended Log File Format, which allows customization of the fields recorded, ensuring that administrators capture the most relevant data. Other formats include the IIS Log File Format and NCSA Common Log Format, each with its own structure and level of detail.
One of the primary reasons IIS logs are valuable is their role in troubleshooting server and website issues. If a website is experiencing slow load times, unexpected errors, or downtime, analyzing IIS logs can help identify the root cause. For example, administrators can use log data to pinpoint high response times, detect 404 errors from missing resources, or recognize unauthorized access attempts. By reviewing error codes and request patterns, IT teams can take proactive measures to improve website stability and security.
IIS logs also play a crucial role in cybersecurity. By analyzing log files, security teams can detect suspicious activities such as brute force login attempts, unusual traffic spikes, or repeated requests from unknown IP addresses. These logs help in identifying and mitigating potential threats before they escalate into full-scale cyberattacks. Regular log analysis allows organizations to comply with security regulations and audit requirements, ensuring data integrity and system protection.
Beyond security and troubleshooting, IIS logs are also useful for performance monitoring and optimization. By examining server requests and response times, administrators can identify performance bottlenecks, optimize caching mechanisms, and balance server loads effectively. This ensures that websites and applications run smoothly, providing a better user experience.
Understanding IIS logs and leveraging their insights is essential for maintaining a secure, high-performing web environment. Whether used for debugging, security, or performance tuning, IIS logs provide valuable data that empowers organizations to make informed decisions about their web infrastructure.
Why are IIS Logs Important for Web Servers?
IIS logs are essential for web servers because they provide a detailed record of all incoming requests, helping administrators monitor server activity, troubleshoot issues, and enhance security. Without proper logging, identifying performance bottlenecks, security threats, or user behavior patterns would be challenging. These logs serve as a crucial source of data for analyzing server performance, detecting anomalies, and optimizing web applications to ensure a smooth user experience.
One of the primary reasons IIS logs are important is their role in diagnosing and resolving server issues. When a website or application experiences slow response times, frequent errors, or unexpected downtime, IIS logs can reveal the cause. By analyzing HTTP status codes, response times, and request patterns, administrators can identify which resources are causing problems and take corrective action. For example, a surge in 500-series errors might indicate a server-side issue, while an increase in 404 errors could suggest broken links or missing files.
IIS logs are also vital for security monitoring. Web servers are frequent targets of cyberattacks, including brute force attempts, DDoS attacks, and SQL injection attempts. By reviewing IIS logs, security teams can detect unusual activity such as repeated failed login attempts, requests from suspicious IP addresses, or excessive traffic from a single source. This information helps in identifying and mitigating potential security threats before they cause significant damage. Additionally, logging is essential for compliance with security regulations, as organizations need to maintain records of server activity to meet auditing requirements.
Another major advantage of IIS logs is their ability to provide insights into website traffic and user behavior. By analyzing logs, businesses can understand which pages receive the most traffic, how users navigate through the site, and where they drop off. This data is invaluable for making informed decisions about website design, content optimization, and performance improvements.
Performance optimization is another key benefit of IIS logs. By examining request and response times, administrators can identify slow-loading pages, inefficient server configurations, and unoptimized assets. This data can be used to fine-tune caching strategies, load balancing, and server resource allocation, ensuring a faster and more efficient web experience for users.
Overall, IIS logs are an indispensable tool for maintaining a secure, high-performing web server. Whether used for troubleshooting, security analysis, or performance monitoring, they provide actionable insights that help organizations optimize their web infrastructure and protect against potential threats.
Best Practices for IIS Log Storage and Retention
Proper IIS log storage and retention practices are essential for ensuring that logs remain useful for troubleshooting, security analysis, and compliance while preventing unnecessary storage consumption. Without a well-defined strategy, logs can accumulate rapidly, consuming valuable disk space and making data retrieval inefficient. Implementing best practices for IIS log storage and retention helps organizations balance performance, compliance, and security needs.
One of the most important best practices is setting an appropriate retention policy. The length of time logs should be retained depends on business needs, industry regulations, and storage capacity. For example, security-focused industries may require logs to be stored for a year or more to meet compliance standards, while organizations focused on performance monitoring may only need logs for a few months. Establishing a clear retention policy ensures that old logs are archived or deleted systematically, preventing unnecessary storage costs.
Another key best practice is compressing log files to reduce disk space usage. IIS logs are typically stored in plain text format, which can consume significant storage over time. Using compression techniques such as GZIP or ZIP can drastically reduce file size while preserving the data for future analysis. Automated log compression tools can be scheduled to run periodically, ensuring that log files remain manageable.
It is also crucial to store IIS logs in a centralized location. Rather than keeping logs scattered across multiple servers, organizations should use a centralized logging solution to collect, aggregate, and analyze log data efficiently. Solutions like Security Information and Event Management (SIEM) tools, cloud storage, or dedicated log management systems such as Splunk or ELK Stack can help ensure logs are easily accessible and searchable. This approach improves log correlation across multiple servers, making it easier to detect patterns and security threats.
Implementing automated log rotation is another essential practice. IIS generates logs continuously, and without rotation, log files can grow excessively large, leading to performance issues and storage inefficiencies. Configuring IIS to rotate logs daily or based on file size helps keep log management structured and prevents performance degradation.
Finally, securing IIS log files is critical to prevent unauthorized access. Logs contain sensitive data, such as IP addresses, requested URLs, and server responses, which attackers could exploit. Organizations should apply strict access controls, encrypt logs if necessary, and ensure logs are backed up regularly to protect against accidental loss or malicious tampering.
By following these best practices, organizations can ensure IIS logs remain a valuable resource for performance monitoring, security analysis, and compliance without becoming a burden on storage and system performance.